Reduction in sewage discharges must not be misidentified as progress — an in depth look at the 2025 annual spill data
Just 79 overflows saw regulation-led improvements in 2025. That’s just 0.5% of all overflows in England.
31/03/26
If you view one of the headlines from last week's annual sewage discharge (EDM, Event Duration Monitoring) data release in isolation, ‘a 31% decrease in total discharge events across England and Wales in 2025’ could sound like a positive step forward.
But when evaluating an ecosystem, or indeed a water management system, it’s essential to remove the blinkers and look at all the parts contributing to the health and function of the whole. The data and catchment experts at The Rivers Trust have dug into the information provided by water companies, as well as datasets from Water Industry National Environment Programme (WINEP) and the Met Office, to bring the situation into sharper focus.
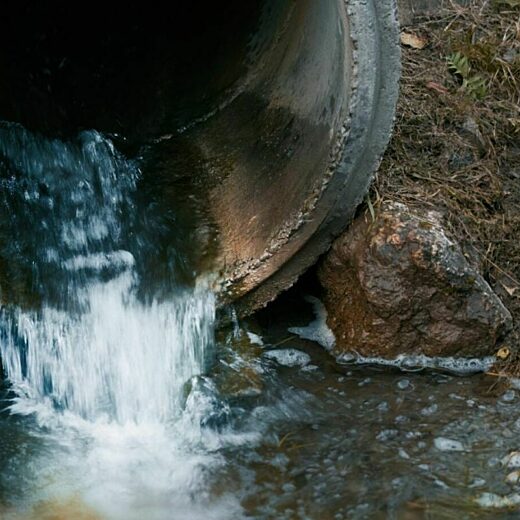
2025 was a substantially drier year than 2024, and with significantly reduced rainfall, a reduction in discharges is to be expected – they're called ‘storm overflows’ for a reason, after all, and discharges are only permitted during extreme weather. Yet, despite large swathes of England declaring drought for long periods of the year, untreated sewage was still discharged into English waterways 291,492 times, for a total of over 1.8 million hours.
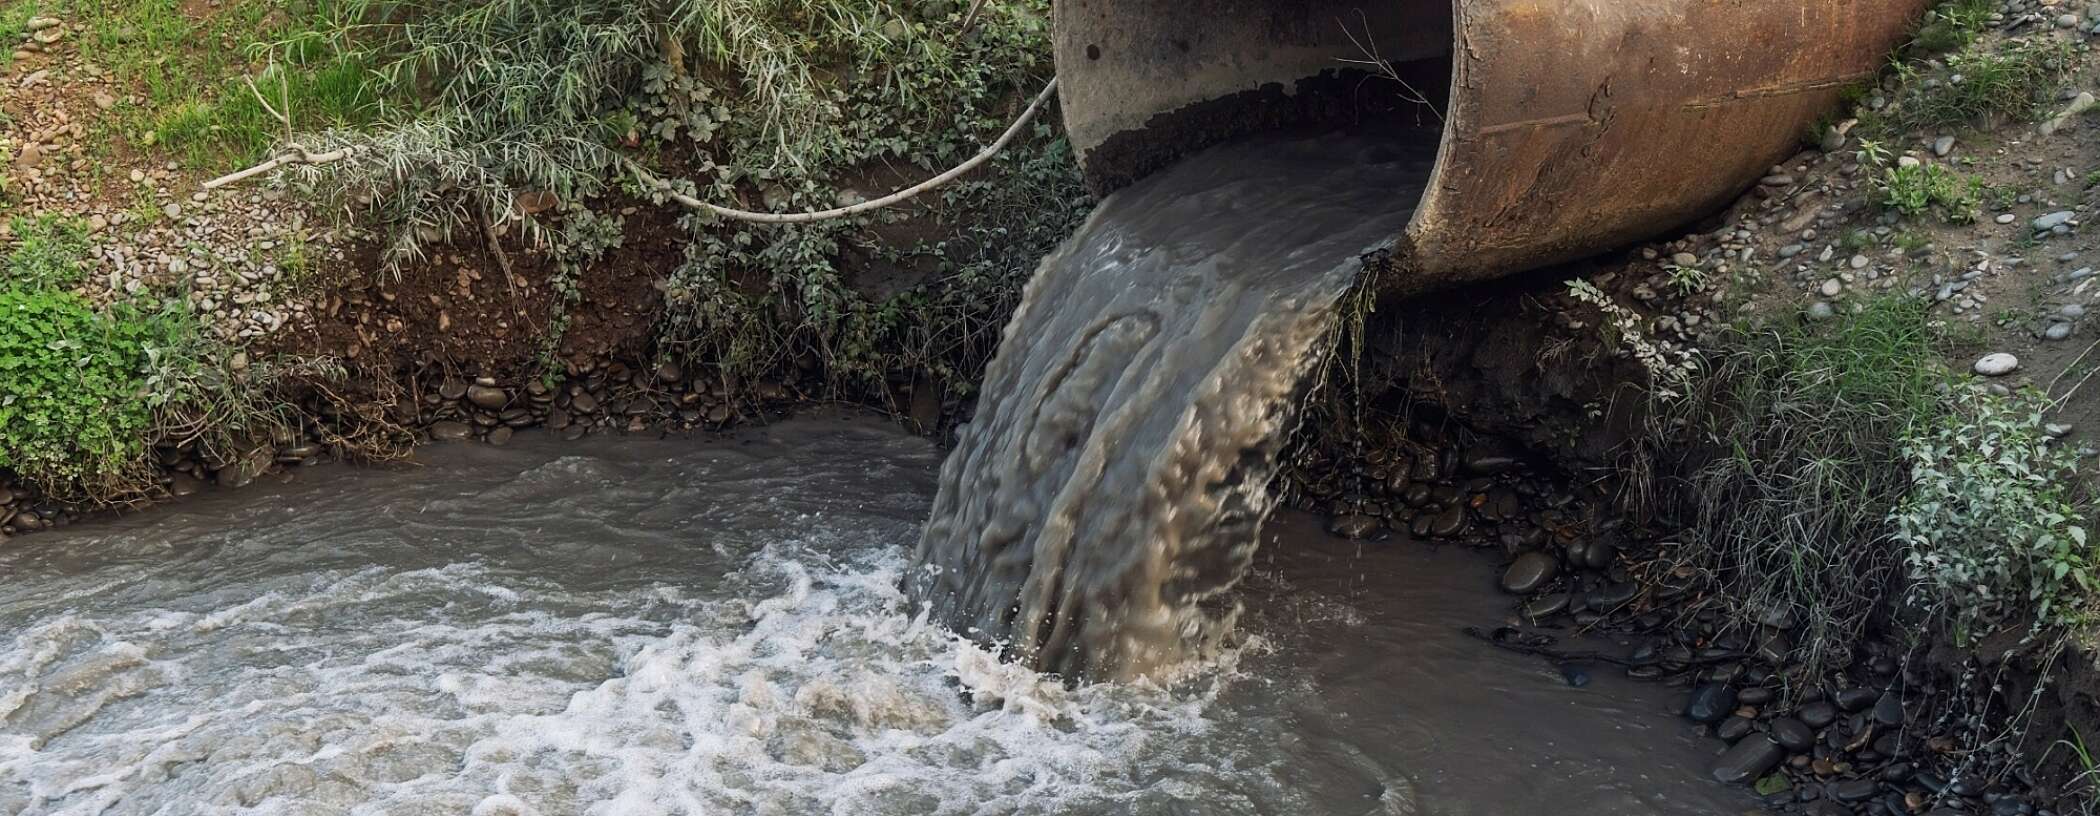
The Thames Water region was nearly 35% drier in 2025 compared to 2024, yet 9,189 discharges still took place throughout the year, totaling 107,822 hours – 60% and 64% less than 2024, respectively.
The 2025 EDM data also provides information about the status of ongoing or completed investigations, detailing each water company-owned storm overflow, and specifying the type of investigation (if any) currently associated with it. Investigations can be operational, focusing on day-to-day performance or regulation-led, leading to capital investment.
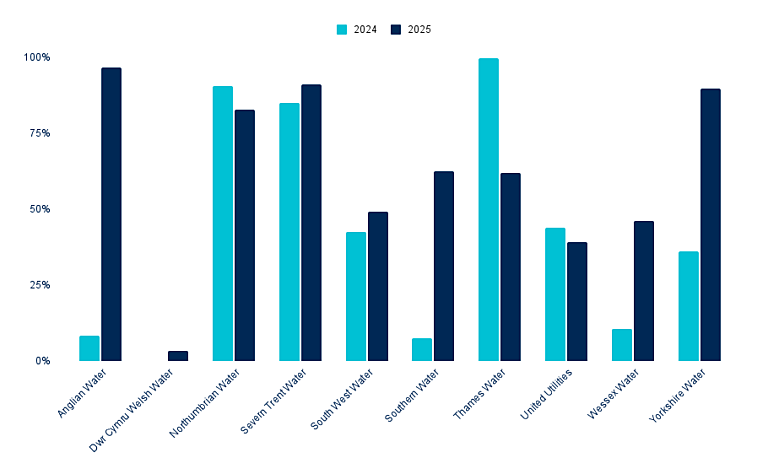
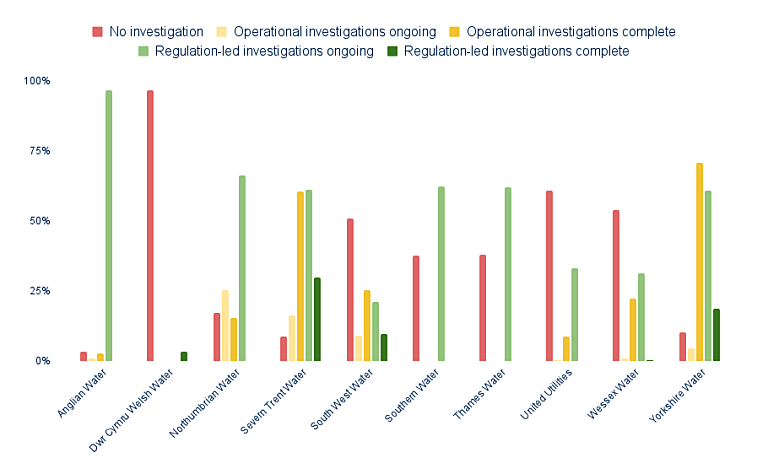
There has been a marked increase in investigations in 2025 with the total number rising to 15,742, equating to a 65% increase from 2024. This uplift is partly driven by the tighter thresholds introduced in the Storm Overflow Assessment Framework (SOAF) 2025, which significantly reduced both the one‑year and multi‑year spill‑frequency triggers for initiating an investigation. Figure 1 shows the percentage of storm overflows under investigation by each water company. However, despite the rise in investigation activity, many of these cases remain ongoing (only 37% were completed in 2025), and only limited on‑the‑ground action or tangible improvements have been delivered so far.
These investigations fall into two broad categories:
- Regulation‑led investigations - such as those required under the Storm Overflows Discharge Reduction Plan (SODRP), part of the Environment Act. These can result in capital investment, including significant infrastructure upgrades.
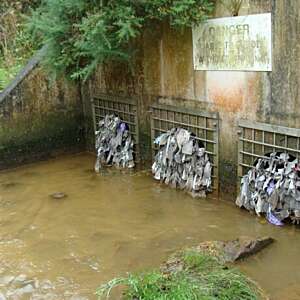
- Operational investigations, focused on day‑to‑day performance issues. These typically lead to operational improvements, such as adjustments to staffing levels, enhanced maintenance activities, or increased screen cleaning.
The following graph details the category and progress of investigations in 2025 by water company for storm overflows in England. It’s important to note that in this series of graphs, the Dwr Cymru Welsh Water bars only represent their storm overflows in England, not the majority of Dwr Cymru Welsh Water’s storm overflows, which are in Wales. A single storm overflow may be subject to as many as four simultaneous investigations, and many are currently undergoing both regulation‑led and operational reviews.
The data also reports on whether improvements have been carried out on assets. For many water companies in England, it is clear that although investigations are being undertaken, it is not yet translating into meaningful action on the ground. The proportion of assets that have been improved in 2025, or were still being improved at the end of the year, remains very low. Severn Trent Water and Wessex Water have reported the highest percentages of improved assets, while Thames Water has reported none at all (see Figure 3).
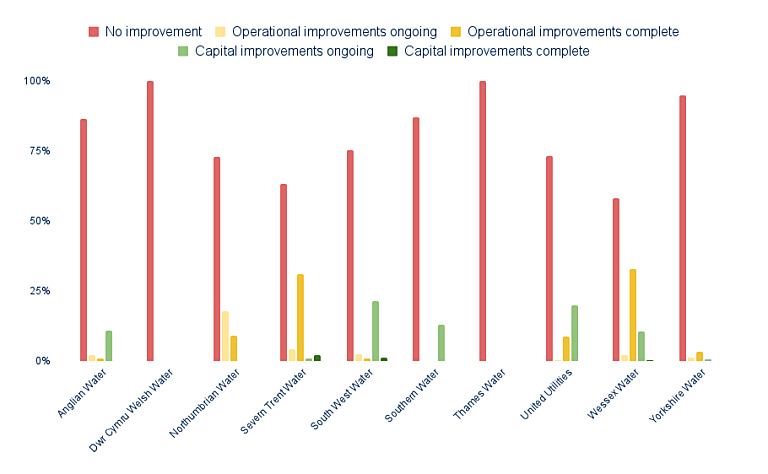
In 2025, Severn Trent Water and Wessex Water led the way with the greatest percentages of storm overflows with completed operational improvements - 31%, and 33% of storm overflows, respectively
Compared to 2024, several water companies (including Anglian Water, South West Water, United Utilities and Wessex Water, have reported a greater % of storm overflows with ongoing capital improvements. However, not a single water company reported capital improvements on more than 25% of their assets, and very few of these improvement works have actually been completed. Some even reported 0 capital improvements in 2025, either ongoing or complete – Thames Water and Northumbrian Water, we’re looking at you.
To sum it up: just 79 overflows saw regulation-led improvements in 2025. That's just 0.5% of all overflows in England.
Figure 4 shows a map of the storm overflow operational and capital improvements by water company.
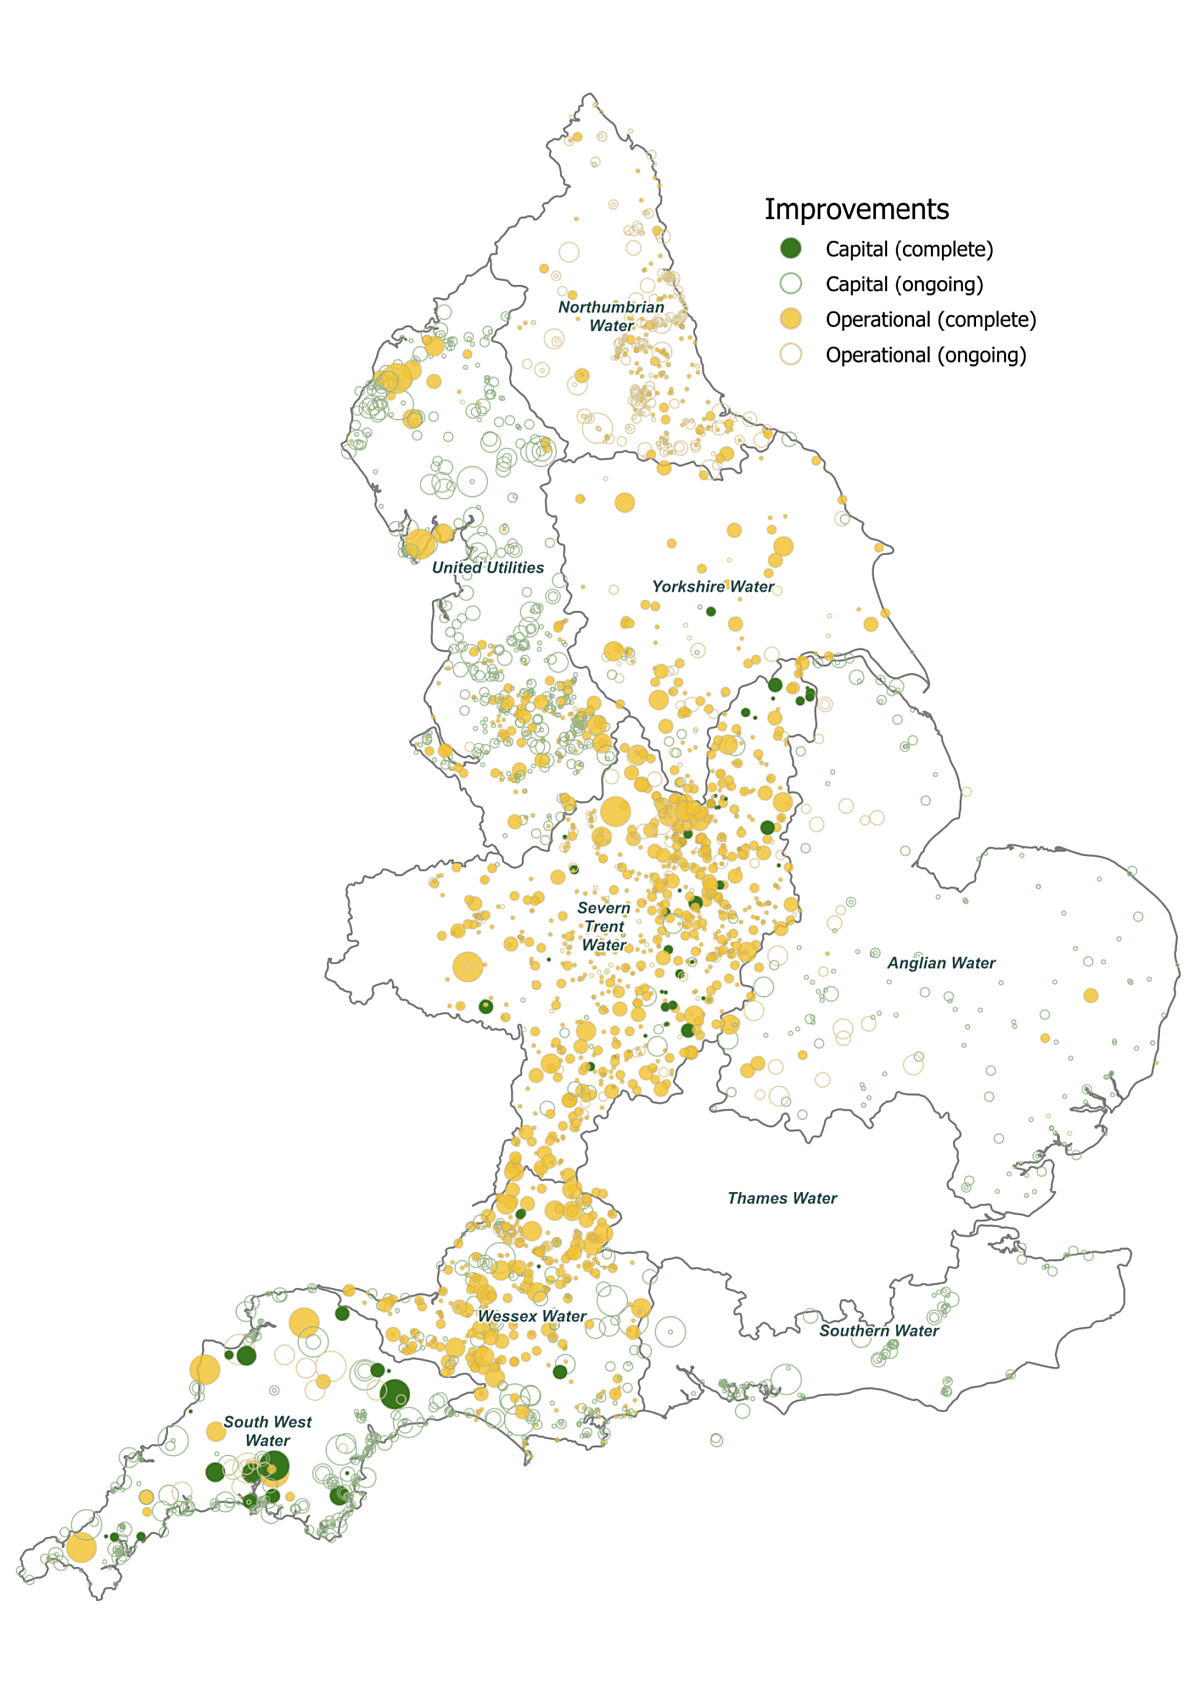
In Figure 4 above, the bigger the circle, the greater the discharge hours reported at that storm overflow in 2025. Where overflows have been subject to both capital and operational improvements, only the capital is shown on the map.
So, what improvements are being delivered?
To better understand what is or isn’t happening, we can also look at the data for Asset Management Period 8 (AMP) - the eighth five-year regulatory cycle (April 2025 – March 2030) for water companies in England and Wales, governed by Ofwat. When we dig deeper into the data, we can see that AMP8 investment and improvements of storm overflows has yet to start. So far, any actions related to reducing storm overflow discharges has mostly been installation of monitoring equipment. Actual improvements of assets themselves are expected to be taking place in early 2026 – so will not have had an impact on the 2025 EDM annual discharge summaries. While it could have been a possible indicator of things looking slightly better for our waterways in 2026, just 29 storm overflow improvements have an expected completion date within the first quarter of the year across England and Wales – and it’s already been a very wet start to the year.
Using 2024-25 data from Asset Management Period 7 (AMP7), 386 storm overflow improvements were reported, which may also have contributed to some of the reductions seen in the 2025 EDM annual summary data.
It's far too early for water companies or government to claim that reductions in untreated discharges in 2025 are due in part to all the infrastructure improvements which our increased bills are paying for. They haven't yet started the vast majority of capital works, as these are planned to happen over the next 4 years of the AMP8 cycle. The spending that has happened is largely on operational improvements - things like increased staffing, maintenance, emergency response procedures and cleaning of screens and storm tanks, to make everything run more efficiently. All things that should have been invested in for the past few decades.
By Emma Brisdion, Alfie Kelly, Michelle Walker