5 things the Sewage Map can tell you about pollution in your local river
With 6 years’ worth of annual sewage data, plus live discharge updates, find out what our interactive Sewage Map can tell you about pollution in your local river.
18/02/26
Blog
Since launching the Sewage Map 2019, The Rivers Trust has made it easier for everyone to learn about sewage in rivers in England and Wales. We’ve campaigned hard for water companies to be transparent and share data on their treated and untreated sewage overflows, so that we can truly understand the scale of the issue, identify and hold polluters to account, and help us all make more informed decisions about how we interact with our rivers.
By displaying the activity of combined sewer overflows (CSOs), the Sewage Map can tell us a lot about what our rivers are being polluted by. It contains six years of annual sewage discharge totals* – including the collective hours and the number of times sewage flowed into our waterways – so that we can track trends on both local and national scales, and we can pinpoint exact sewage dumping locations, and the waterbodies they flow into. Using data from a network of live sensors (known as EDMs) at each location, we can also show when discharges are happening almost in real-time, when those current overflows began, and what the most recent discharge looked like at any storm overflow location.
At the time of writing, over 1,200 CSOs are actively discharging across England and Wales, and 1,600 have done so in the last two days – including the one nearest my home.
Ready to dive in? (Or not, as the case may be.) Here are five things that you can do with our Sewage Map:
1. Find your nearest storm overflow
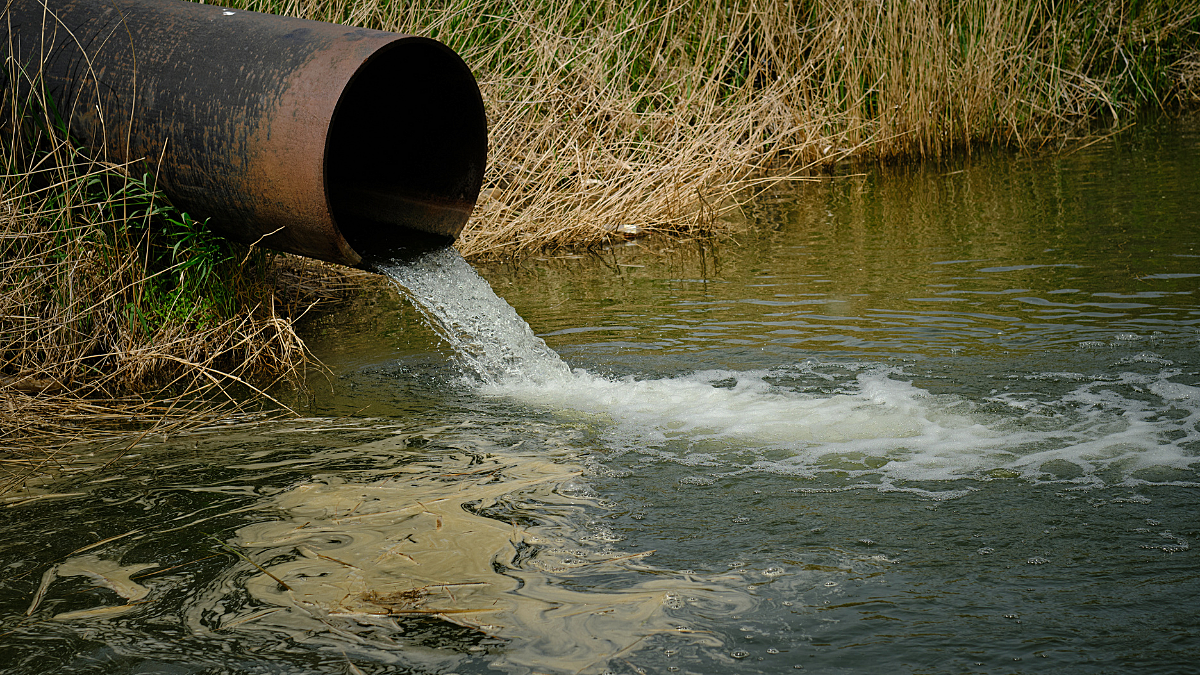
Sometimes CSOs are easy to spot – their open pipe ends might be clearly visible on the banks of your nearby river, or a grate in front of them may be clearly marked by a tangle of wet wipes. Sometimes there’s a smell that gives it away. Other times, they’re tucked out of sight, so you may not realise they are there. Some outflows are large and some are small, some have flap valves covering their entrance, and others are hidden by bankside vegetation or located under infrastructure like a road or bridge. It’s important to know where untreated sewage can enter the water near you, especially if you like to swim or take part in a water sport.
- Use the Near real-time alerts, Annual summary, or Investigate tabs in the Sewage Map to get to know your local patch. Data is available for England (real-time and annual), Wales (annual) and Scotland (real-time).
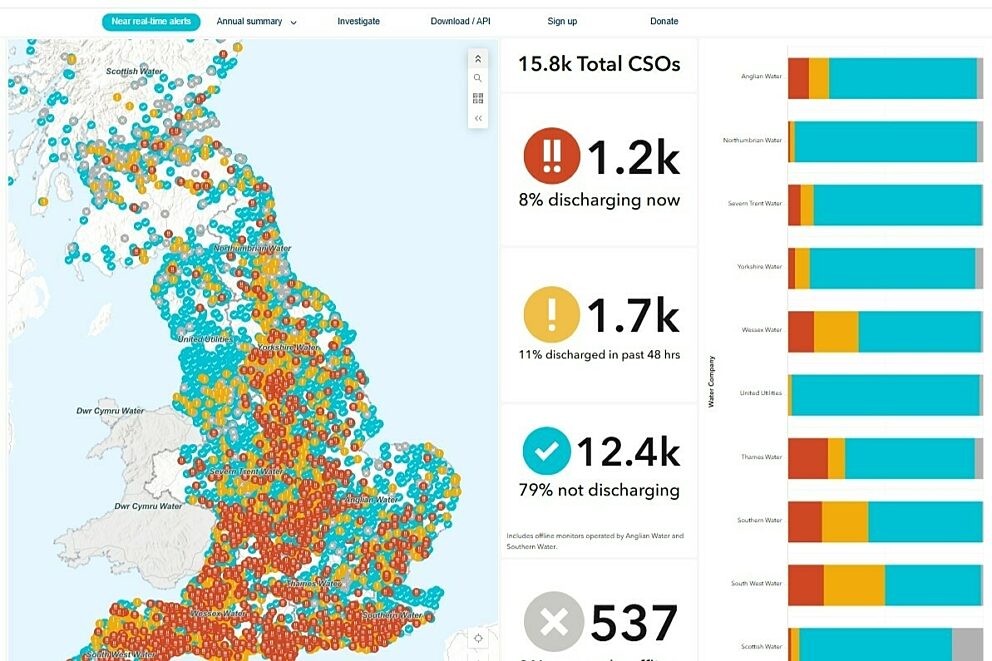
2. See if raw sewage is being discharged from storm overflows right now (or recently)
Thinking of swimming in your local river today, or inflating your paddleboard soon? We can see the almost-live information for just under 16,000 CSOs, and the map displays not just whether they are discharging right now, but whether they discharged at any point in the last 48 hours. CSOs are colour coded to show whether they’re currently overflowing (red), have recently discharged (yellow), or aren’t and haven’t in the last two days (blue). For more details, click on any CSO point to find out more.
- Use the Near real-time alerts tab to see the current state of untreated (raw) sewage spilling activity across England and Scotland.
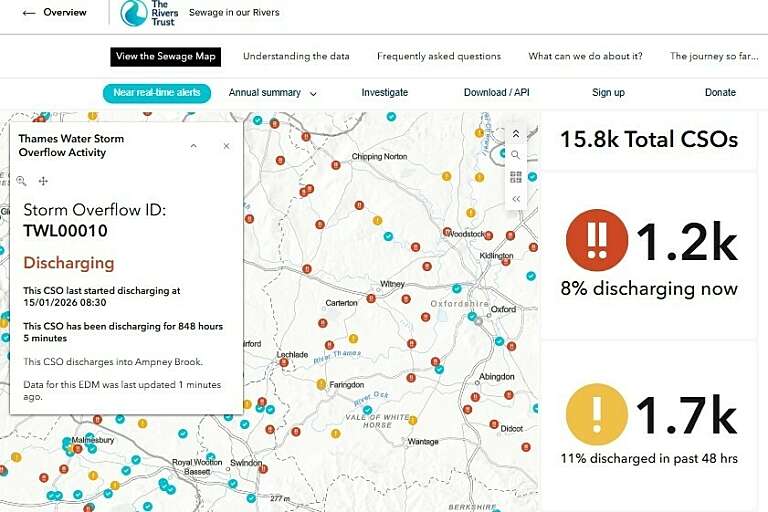
3. Find out how long discharges have lasted, to better understand the scale of pollution
Not all discharges are created equal. Raw sewage shouldn’t be going into our rivers and seas at all, but to understand just how polluted our river stretch is at any one time, we need to know how long these dumps are lasting for. A CSO discharging into a river for ten minutes, for example, will have a different impact on water quality and the ecosystem than a CSO that has been continually discharging for 27 hours.
- Use the Near real-time alerts tab and click on an individual CSO point to see when the most recent overspill took place, and for how long.
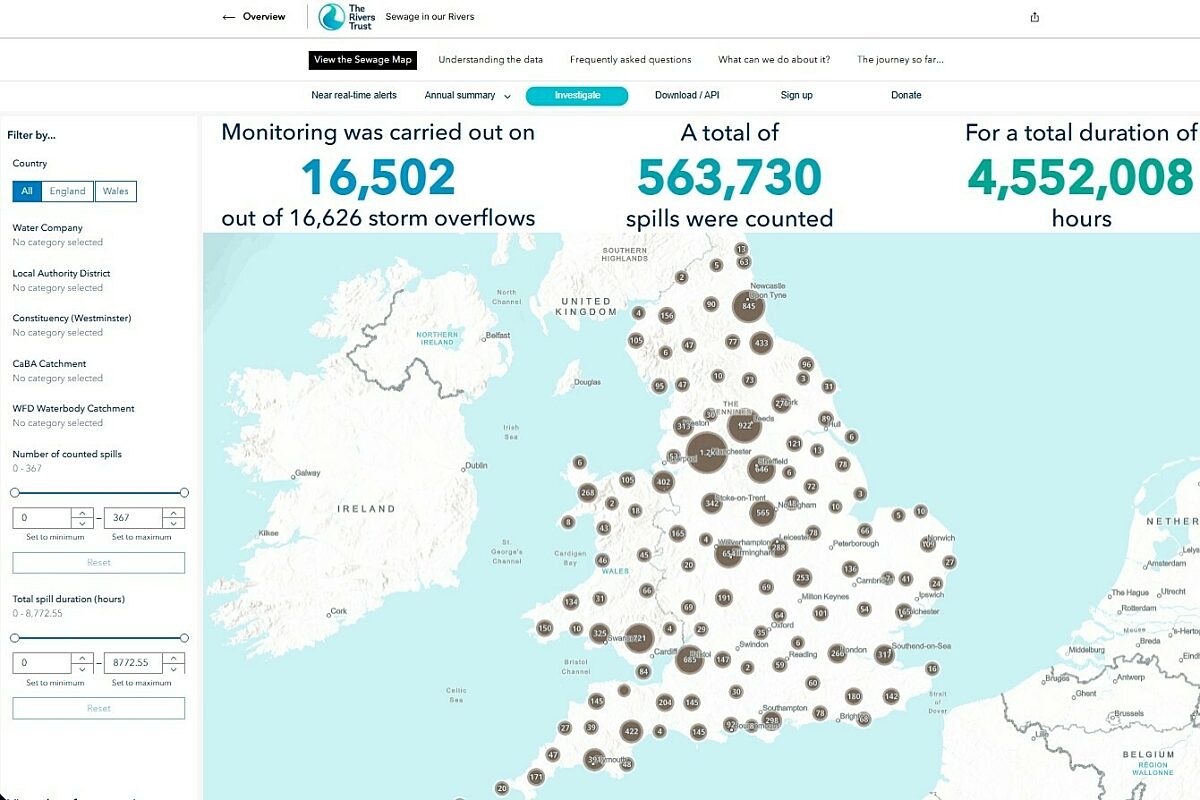
4. Ask specific sewage data questions, like, ‘Has my constituency had it better or worse than last year?’
We've set the map up to allow you to ask a wide range of questions. You can easily filter the yearly data by country, water company, and even constituency. See how many spills were counted, how many total hours sewage was discharged for, and how it has changed year on year since 2021. Use this information to fuel your investigations and make your voice heard – get specific data that’s relevant to your local patch and share it with your communities and your MP.
- Use the Investigate tab to get answers.
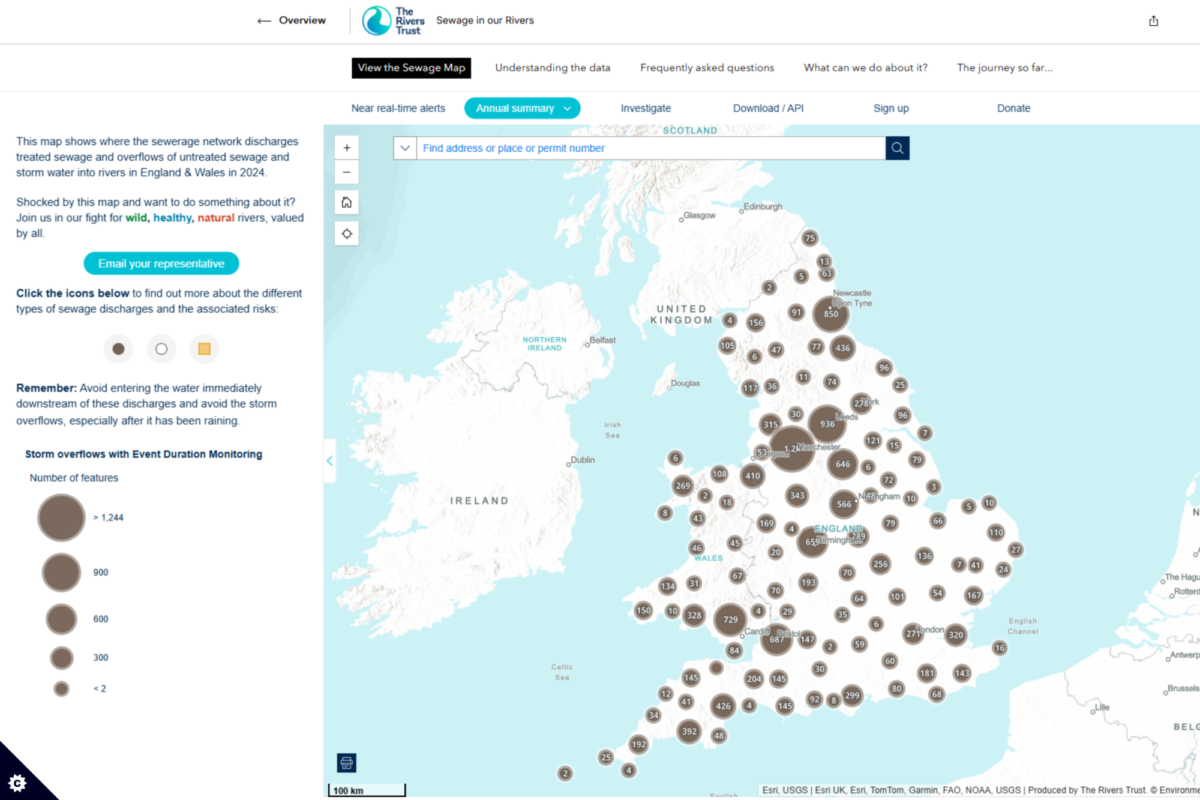
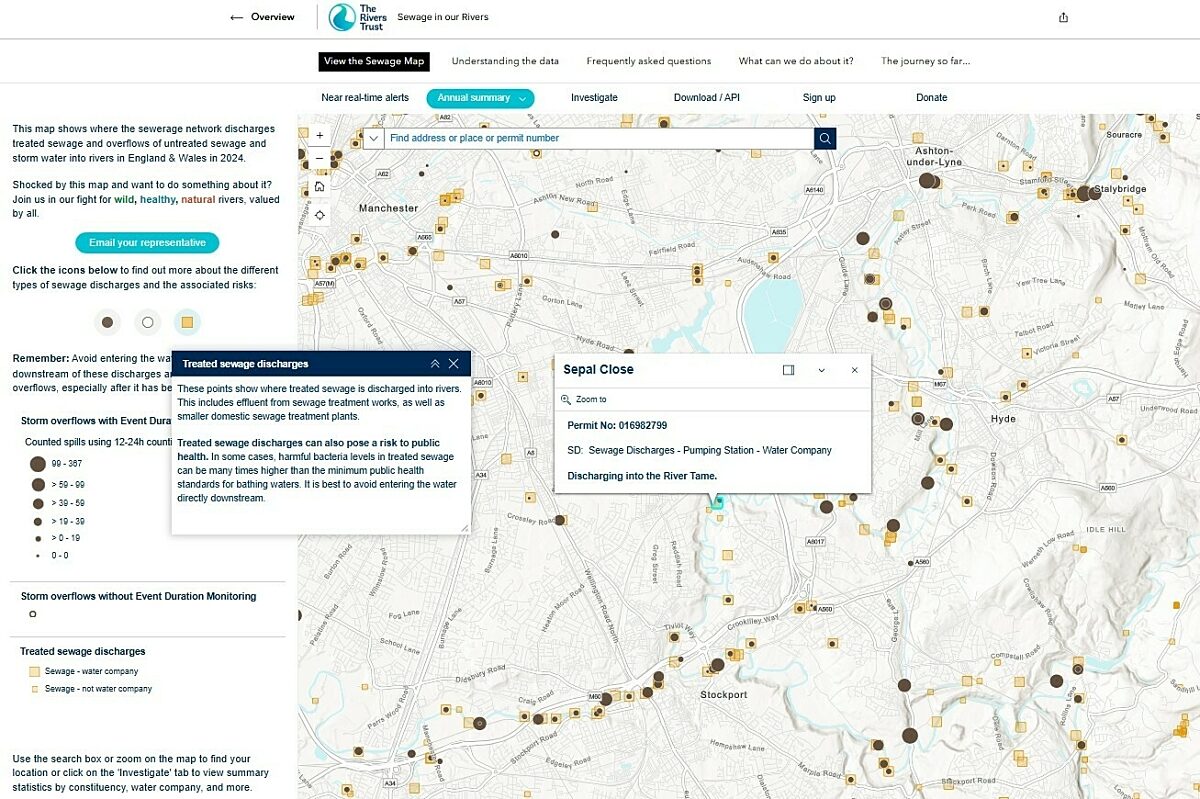
5. Learn about treated sewage (a major polluter), too
The Annual Summary tab doesn’t just show where storm overflows are located (marked by brown dots) – it also displays locations where treated sewage is discharged into waterways (marked by yellow squares). It’s a common misconception that treated sewage is any better for the environment – the evidence we do have paints a different picture (read our State of Our Rivers Report for more detail). Continuous sewage discharge (where treated water is released into rivers non-stop) causes more river stretches to fail their health tests because this form of pollution is relentless. While the treatment processes aim to remove things like wet-wipes, other sanitary items, organic matter (poo) and some nutrients, the effluent at the end still contains pollutants which aren’t removed, like chemicals and pharmaceutical products, residual levels of nutrients and bacteria.
These can have a huge impact on river ecosystems – nutrients can cause eutrophication and harmful algal blooms, and pharmaceuticals can be toxic to aquatic life, including fish and insects. Additionally, only treatment sites with UV sterilisation can combat harmful bacteria, and not many of them have this! UV treatment is required only for water treatment upstream of designated bathing water sites, and only during the bathing season (May to September).
- Use the Annual Summary tab to identify where treated sewage enters rivers near you.
Visit the Sewage Map 💩
Ready to find out what's being discharged into our rivers?
Background:
What is the Sewage Map?
Our technical team has made data freely accessible and, importantly, interactive – to find your nearest reported sewage outlet, simply zoom in on the map. You could be closer to one than you may think. To start with, we mapped outfall locations, sharing whether they were fitted with monitors that reported on their sewage discharge activity, and displaying any available annual summary information, such as how many times each location discharged over the course of a year, and the total hours that sewage had been released at that location. At the time, not every outflow had monitoring (far from it!), so there were huge gaps in our knowledge, and ‘total’ spill hour numbers reported simply weren’t accurate – they could have been missing thousands of hours. Monitoring is now carried out on almost 100% of all storm overflows.
This summary data is shared annually and can help identify long-term pollution hotspots, but sharing information once a year simply isn’t enough to support communities that frequently use rivers. Alongside others, we campaigned for getting live data from each of England’s water companies – it is now mandatory for English water companies to publish real-time alerts of sewage discharges into waterways, and we’ve been able to integrate this into our Sewage Map too, alongside Scottish Water’s real-time sewage monitoring alerts covering Scotland. Data for Wales can be found on the storm overflow maps on the Dyr Cymru Welsh Water and the Hafren Dyfrdwy websites, but can’t yet be integrated into our Sewage Map.
We don’t just build, we ‘QA’ the data, too – our experts dive into the murky depths of the Excel spreadsheets to check the quality of the numbers and locations we’re provided, before including them in our map. This eliminates some errors or incorrect readings that could change the summary figures.
*2025 annual summary data will be released in late March/early April 2026, and added to the Sewage Map shortly after.