[The Source Code] GIS over time: mapping through millennia and modern river restoration
From stone carvings and ancient papyrus to paper charts, acetate overlays, and today’s digital GIS, the story of mapping water is as old as civilisation itself. This blog explores how mapping has evolved through history and how those tools now help us understand, protect, and restore our rivers.
Part of [The Source Code] series: regular tech and data insights from The Rivers Trust’s Heather Bell, celebrating the digital tools and teams powering environmental change. Sign up to our newsletter to get every piece delivered to your inbox.
11/08/25
Blog
The Rivers Trust Movement has always been underpinned by data and evidence. In the early days before digital cameras, farm plans were produced by photographing maps at local council offices, developing the films, and then physically sticking these into documents. Later, we began using Geographical Information Systems (GIS), a mapping technology that allows us to collect, create, manage and analyse computerised map data.
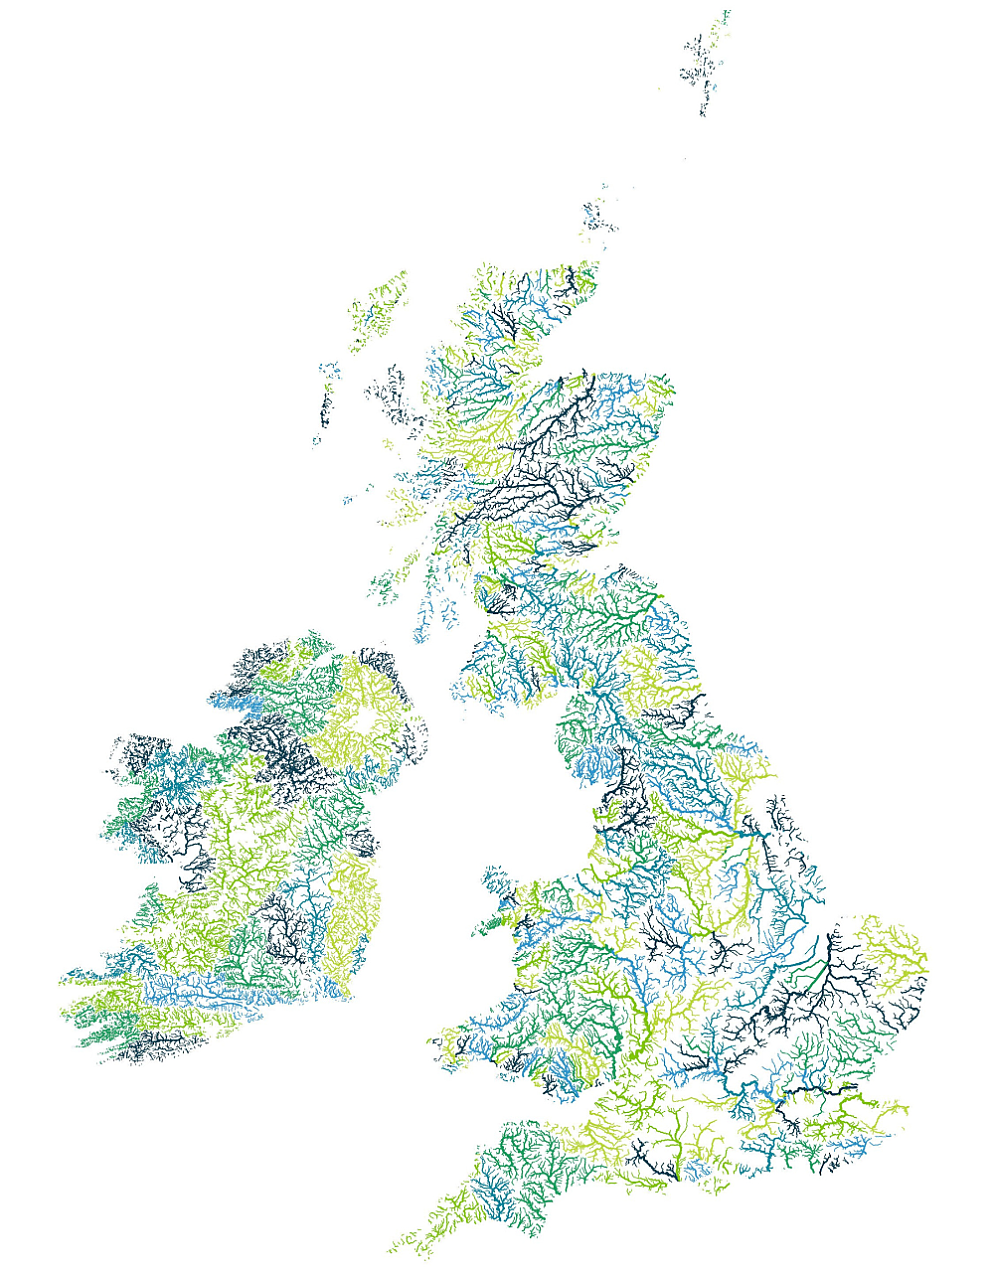
The first GIS was set up for what is now the West Country Rivers Trust using aerial photography to interrogate what was happening on the ground. Many concepts grew out of this early work, helping us to understand water management and analyse data at a catchment scale to tackle issues in the rivers. Some say that Geographical Information Systems existed in analogue before computers, even if we didn’t have the word for this. Ancient maps depict water and dry riverbeds, and markers for tsunami heights in Japan are etched in stone. These geographical indicators show how cultures have long recognised the importance of water for life and sought to record it. The earliest known GIS is often thought to be the ancient Egyptian Turin Papyrus map, and one of the most recognisable modern spatial analyses is a heat map showing the outbreak of cholera against the location of the water pumps, published in 1854.
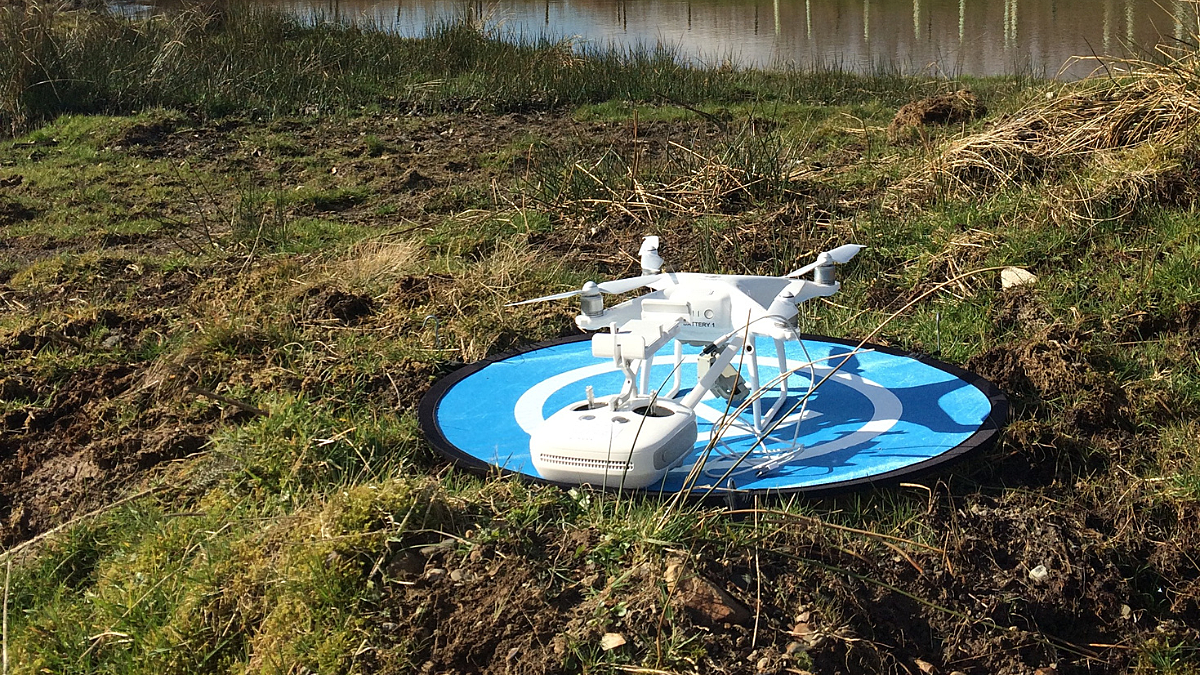
Through history, the importance of water has been mapped in paper, stone, and fabric, to sheets of acetate layered on overhead projectors, and now in digital layers viewed behind a screen. Water is life, and by using all the tools which are available to capture important data - whether that’s professional drones, or smart phones - we can understand the issues in our rivers and better address them.
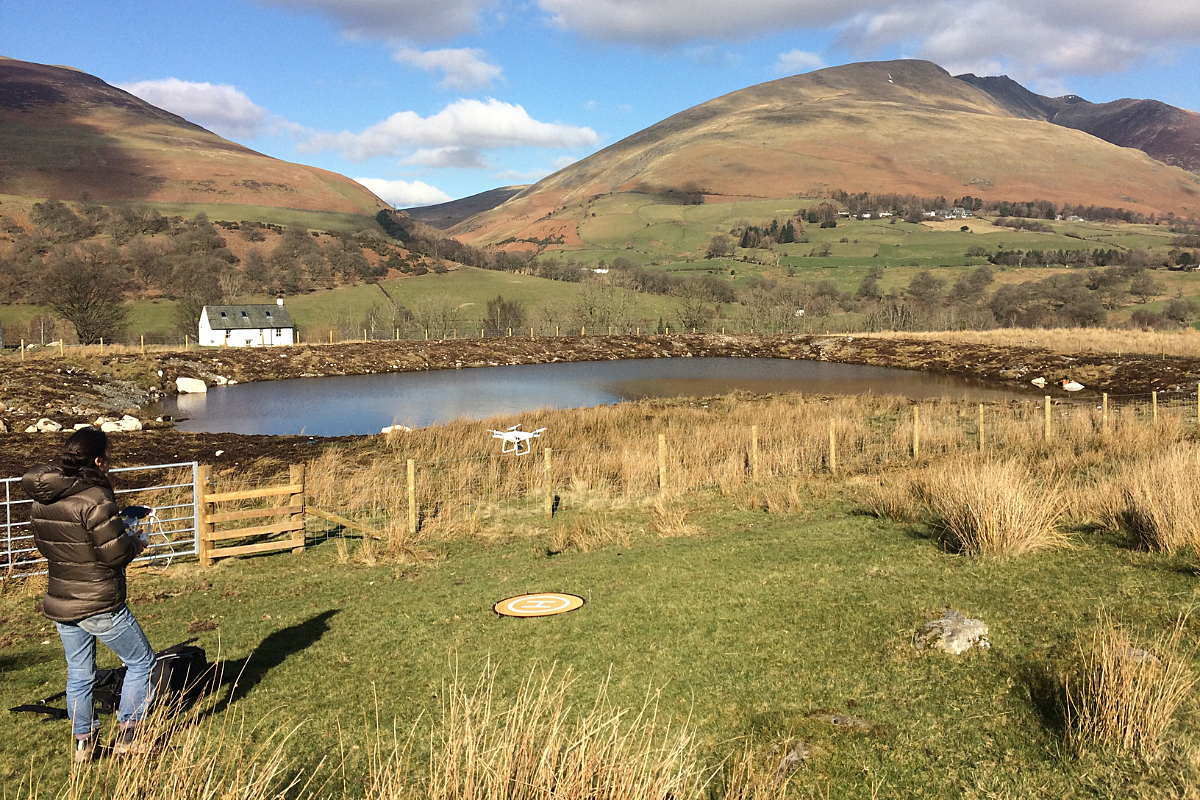
Nowadays, at The Rivers Trust, we have a large technical team who work behind the scenes, collecting data and building spatial datasets with information from satellite imagery, drones, phones, and water quality monitoring (to name just a few sources). Our aim is to democratise data, including publishing data in ways which are more accessible to the public, like our Sewage Map. Our data and GIS analysts also create platforms for citizen scientists to collect river health data in standardised formats to strengthen the evidence base and build a picture of what is truly happening in our rivers.
Getting a clear picture of the state of our rivers is not a simple task. We can only truly understand how are rivers are faring by using the data and evidence that we have available to us and pushing for better methods and data availability in future. We could, and should, do this by collecting water quality samples more frequently, harnessing the potential for AI, listening to anecdotal evidence or indigenous knowledge, and empowering communities in collecting their own data through citizen science.
The State of Our Rivers Report explores the health of our rivers using GIS data which our technical team have aimed to make more accessible to the wider public, in the form of a Storymap. Explore the report here to understand the threats and pressures our rivers face, and see solutions and how we can take action.
An introduction to GIS
Learn more about GIS, what it is, why we use it, and discover tips on how to get started.